Published on : Oct 21, 2014
Category : BizTalk360 Update
We are still maintaining the agile way of building BizTalk360, listening to customers feedback and bring 4-5 key features in every release once in 4 months. Our last major release 7.5 was back in July,2014. You can view our complete
release history here.

In this version we are adding the following key capabilities
- Advanced Process Monitoring and dashboard
- EDI reporting capabilities inline with BizTalk Admin Console
- System Profile : Ability to remove features you don’t want in BizTalk360
- User Profile: Flexibility to set custom time zone and date/time format for each user
- Removed Orphaned artifacts from Monitoring: Ability to remove old orphaned artifacts like Applications, that no longer exist in the environment.
In the first part of the 7.8 release article, let’s take a deep look at the advanced process monitoring capabilities and in the second part we will cover the remaining features.
Advanced Process Monitoring and Dashboard for BizTalk Server
What is process monitoring? In a middleware system like BizTalk server, sometimes there will be a requirements to keep an eye on the transaction volume of messages being processed either for SLA purpose or to avoid any issues. Examples: 2000 orders need to be processed via SAP receive location, 1 file received via FTP port every midnight etc.
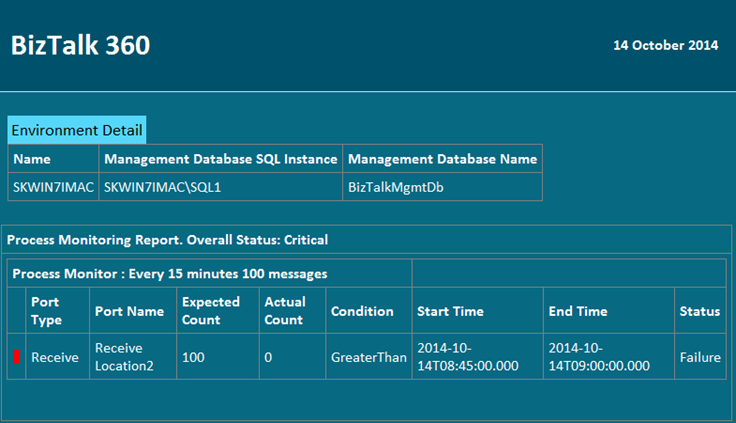
We had process monitoring in BizTalk360 for a very long time, and it served the purpose fine. The original process monitoring configuration screen looks like this
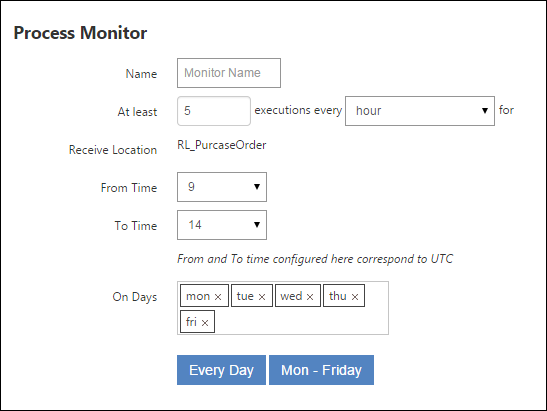
which allows you to configure expected message volume either hourly or daily, via a particular receive location or send port, between certain times like 9am to 5pm, on certain days of the week like Mon to Fri. You can configure multiple process monitoring for the same ports to cover various frequencies at various time periods.
This is absolutely fine implementation and it served the purpose really well. But we identified there are lot of room for improvements and it could be a key monitoring feature for a middle ware system like BizTalk Server. So we went back to the drawing board and instead of modifying the current one, we wrote a completely new one called “
Advanced Process Monitoring“. The new screen looks like this
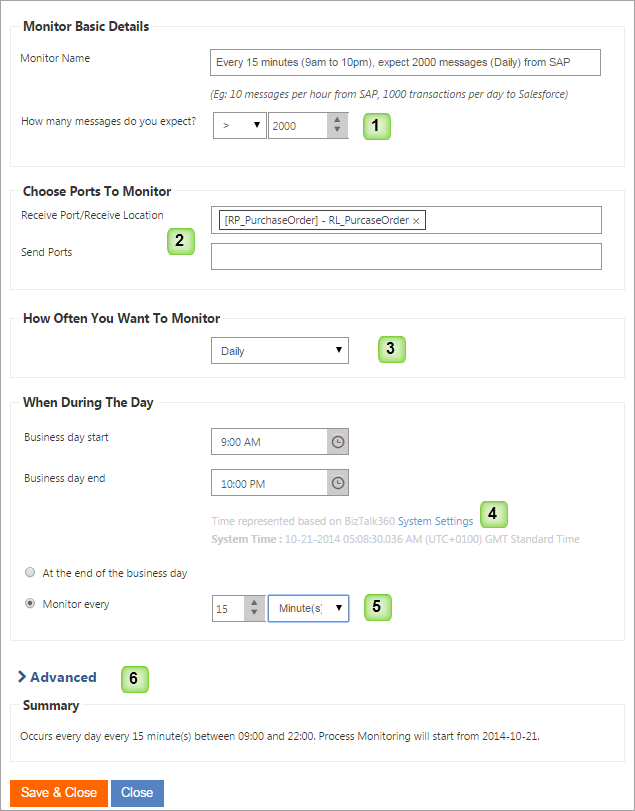
Let’s explain bit more on the numbers listed on the screen above
#1: You can set the expected volume of messages and also choose the required condition like Greater than (>), equal to (=) or less than (<). In the previous version we only had greater than option.
#2: You can multi select multiple receive locations and/or send ports in one go. In the previous version, you need to manually configure one by one.
#3: You can set up Daily, Weekly and Monthly frequency. Example: 16th day of each month. This option was not there before
#4: Now can you precisely set under which time zone setting the process monitoring should work. In the previous version, you need to set using UTC
#5: You have full control and time window, you can go as low as every 15 minutes, or as high as you want. In the previous version, only hourly/daily interval was possible. You can also span days for example 9pm in the evening to 6am in the morning.
#6: Using advanced feature you can start the monitoring in the future. Example: Start from next week, next month or during Christmas etc.
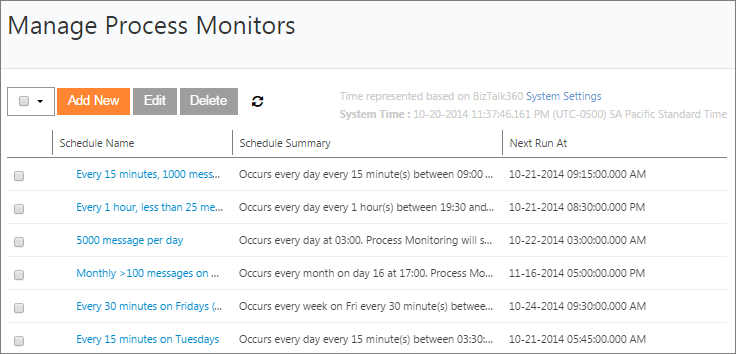
Managing Process Monitors
You can configure multiple process monitors based on your requirement as listed above and you can manage all of them from a central place as shown below. You can also notice the system clearly shows when the “Next Run” date time will be for each process monitor, making it very clear, in addition to the schedule summary.
Process Monitoring Dashboard
Configuring and managing process monitor(s) is just one side of the story. You also wanted to get a clear visibility of those configured process monitoring. Hence we build a brand new dashboard purely for the visibility of process monitoring.
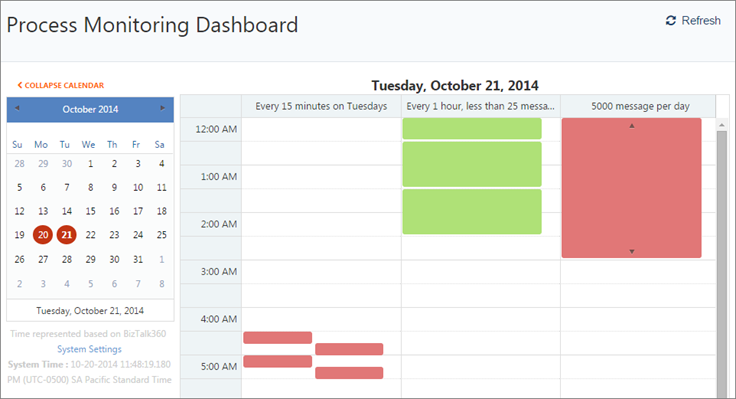
As you can see from the above picture, on the LHS it shows a calendar control with colour coded dates. If there are any errors (transaction volume not met) on a particular day it will turn red. You can click on the date and on the RHS it will show columns of various process monitors configured and their state during the entire day. Process monitor blocks will occupy the correct time slots based on their configuration and it’s also colour coded for easy visibility. User can then click on the specific block, which will open up a detailed windows as shown below explaining clearly what’s the problem
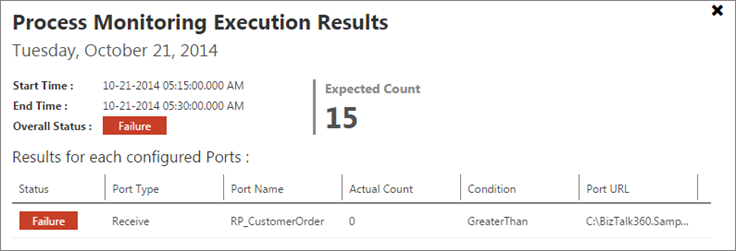
Clear Email reporting
It’s great to login into BizTalk360 web application and see all the process monitoring statuses via dashboard, but often times you may just want to get notified via email about the status of your process monitoring. This is also well covered in this release. You’ll receive notification similar to the one below, clearly highlighting any issues.
Conclusion
Team of 4-5 people worked for the past 3 months on bringing “Advanced Process Monitoring” live. We iterated through multiple designs changes, architecture changes underneath to support this in a clear way. For example process monitoring dashboard didn’t fit with our current monitoring dashboard, after fiddling around for sometime we decided process monitoring requires it’s own dashboard. In a similar way we need to make changes to our core alarm functionality to support process monitoring. Handling date and time is another big area (ability to set system regional settings) we worked behind the scene, which is core part of process monitoring, since it’s all about dealing with date time and message count.
In the
next part of this article, we will cover all the remaining features we are bringing in 7.8