
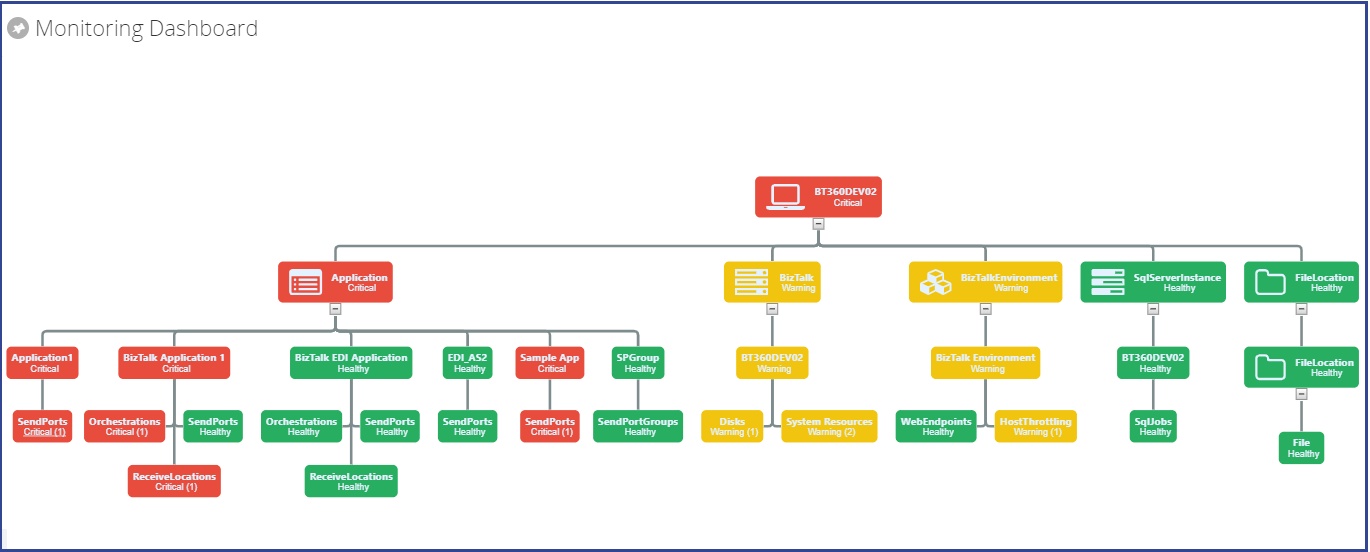
BizTalk360 comes with out of box capabilities to monitor BizTalk Artifacts, BizTalk Environment, Queues (IBM, Azure Service Bus and MSMQ), File Location (File, FTP and SFTP) and so on. The Monitoring Dashboard represents the Monitoring Status in a nice graphical chart view. Different set of users like BizTalk Administrators, Operators, Technical members and Business users are using the monitoring features for their day to day activities. Users create multiple alarms to suffice their needs to monitor the health of their BizTalk environment.
While users are monitoring the multiple alarms, they must keep an eye on multiple dashboards. It is a cumbersome task if a user takes care of more than two Alarms. Based on this requirement, few customers have requested for consolidate view of alarms. In this article, we are going through the process of how you can create a consolidated view of multiple alarms using Custom Widgets.
BizTalk360 users are configuring the alarms based on their business vertical or alignment to their process. There have been different patterns in alarm configurations. We can see some of the commonly used patterns;
Configuring BizTalk Artifacts, Web Endpoints, Queues, File Location etc. of integration in an alarm.
BizTalk Administrators will look after infrastructure settings like Disk, System Resources, BizTalk Host Instances and configure in an alarm BizTalk Operators can configure BizTalk Artifacts and other entities in a single alarm
For instance, users can configure all their Queues (IBM/Azure Service Bus) in an alarm. Similarly, they can configure Web Endpoints, Infrastructure (Disks, System Resources) in separate alarms.
Based on the above patterns, Role-based and Entity-based alarms can have a single view of multiple alarms in which you can monitor all the entities. When you follow the Integration-based alarm pattern, then entities like Application Artifacts, Azure Service Queues and BizTalk Server health activities are in different alarms.
Many organizations follow the Integration pattern by grouping all the related artefacts in an alarm. In this scenario, users (BizTalk Operators/BizTalk Technician) must monitor multiple alarms. For Instance, BizTalk Operators looking after BizTalk Artifacts or Developers responsible to monitor Azure Service Bus Queues will have to monitor the multiple alarms. Let’s see how to overcome this challenge by using custom widgets to group multiple alarms.
The Monitoring Dashboard is one of the most used features among the users to monitor BizTalk Environments and Artifacts in BizTalk360. An enriched monitoring capability while using Custom widgets to group the multiple alarms to get a single view based on business or team members role.
Custom Widgets are a powerful feature in BizTalk360, as such widgets will provide the opportunity to meet their business scenarios. Many customers adopted Custom Widgets to provide solutions to end users.
Following are a few illustrated scenarios of grouping alarms when it is configured based on integrations
In this article we take one of these scenarios, to show how users can achieve the grouping alarms using Custom Widgets
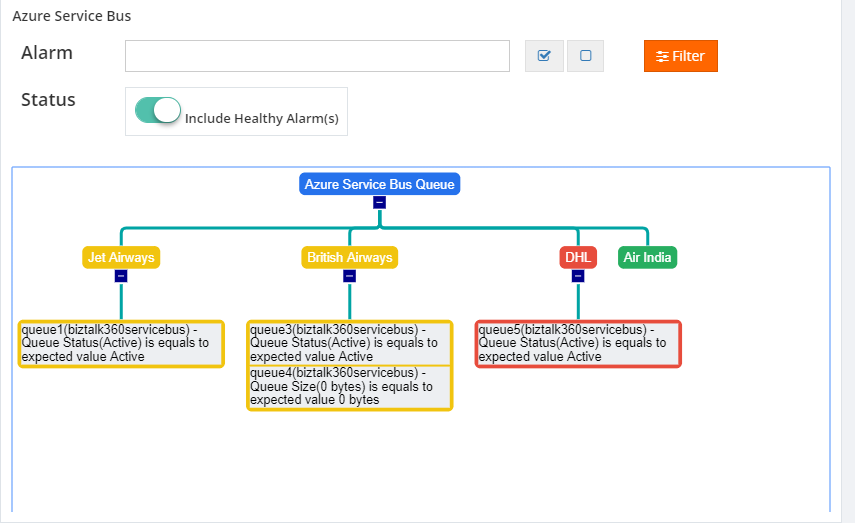
Custom Widgets used BizTalk360 Secure SQL Query API’s to fetch all Azure Service Bus Queues Monitoring Status from BizTalk360 Database. A user can select the filter with different alarms they want to group.
By default, the user can see only the unhealthy queues in an environment. If they set the Enable Healthy Queue option, they will be able to view all queues in the tree nodes. The Azure Service Bus Queues Custom Widget will fetch the information from Secure SQL Query with a refresh interval which is configured in the script of the custom widget.
Follow the below steps to achieve the Custom Widget’s script;
Create the Secure SQL Query to fetch the monitoring status of Azure Service Bus Queues in the environment. To know more about how you can execute Secure SQL Queries using custom widgets, refer to this article.

Create the initial variables, Place holders and SQL Query to call the BizTalk360 API method in the Custom Widget’s script
azureQueueRefresh = 20;
username = "`username_812414`";
password = "`password_701422`";
environmentId = "`productionenvid_189308`";
queryId = "8eea2771-10a7-44c6-8709-a597687434cf";
queryName = "Azure ServiceBus Queues";
sqlInstance = "kovai-bts";
database = "BizTalk360";
bt360server = "biztalk360.westus.cloudapp.azure.com";

// The SQL Query which needs to be executed from the custom Widget
sqlQueryForAzureGraph =
"Select AA.Id,AA.[Name],AME.MonitorStatus,AME.ExecutionResult from [dbo].b360_alert_MonitorExecution] AME
Inner Join[dbo].[b360_alert_Alarm] AA ON AME.AlarmId = AA.Id and AME.MonitorGroupType = 'Queues'
WHERE AME.LastExecutionTime = (SELECT MAX(LastExecutionTime) from [dbo].[b360_alert_MonitorExecution]
WHERE MonitorGroupType = 'Queues' and AA.IsAlertDisabled='false' and AlarmId = AA.Id and LastExecutionTime > DATEADD(MINUTE,-60,GETUTCDATE())) AND AME.EnvironmentId ='`productionenvid_189308`'";

//Mention the created alarm details and the respective partner name to display in the graph.
AlarmDetails = [
{ AlarmName: "Threshold-1", PartnerName: "Air India" },
{ AlarmName: "Threshold-2", PartnerName: "British Airways" },
{ AlarmName: "Threshold-3", PartnerName: "DHL" },
{ AlarmName: "BizTalk360 Default Alarm1", PartnerName: "Jet Airways" }
];
BizTalk360 uses the GO JS Framework- Organization chart to represent the monitoring hierarchical view in the UI. It will display the organization chart structure as Azure Service Bus Queue node as a root node, Integration friendly name as second level node and Queue threshold violation details as a child node. You can control the nodes expand/collapse capability of through the custom widget code.
Users can able to filter the data based on the selected alarms or the option to show healthy queues. By default, users can see only unhealthy Azure Service Bus Queues. Similarly, other scenarios are implemented through custom widgets.
To get the full source code of the Custom widgets you can download it from our GitHub Project.
We hope this article is useful in grouping the multiple alarms into a single view in an environment.
This will bring you more control over the custom development you may want to achieve. Get started with the free 30 days trial.
For any queries/feedback please write to us support@biztalk360.com.