Published on : Jan 18, 2018
Category : BizTalk360 Update

This blog is a part of the series of blog articles we are publishing on the topic “Why we built XYZ feature in BizTalk360”. Read the main article
here.
Why do we need this feature?
As a BizTalk Administrator, it is critical to constantly have a good overview of the health of the BizTalk environments for which the BizTalk Administrator is responsible. To be able to consider the health of BizTalk Groups, it does not stop by knowing whether all ports and orchestrations are started. There are so many other aspects which are relevant to get the full picture of the health. Think of, for example, the state of the Host Instances and SQL Server jobs, the number of suspended service instances, all kind of Windows services, ESB Exceptions, EDI transactions, etc.
It would take BizTalk Administrators a lot of their precious time to constantly check the actual health status of all these different artifacts.
What are the current challenges?
One of the main challenges with the out-of-the-box tooling of BizTalk Server is that it is not possible to have the needed information available in one view. To get that overview you need to look into multiple screens and browse through multiple applications. For example, multiple screens of the BizTalk Server Administration console, SQL Server Management Studio, the portal of the ESB toolkit, Remote Desktop sessions to access the Windows server, etc.
At
BizTalk360, we think this is far from efficient as it would take the BizTalk Administrators too much time just to get the overview information. In our opinion, BizTalk Administrator should spend his time on better things, than constantly going from one console to another, just to find out the current health of the system.
How BizTalk360 solves this problem?
BizTalk360 has the concept of Dashboards. These highly customizable Dashboards can show different types of data. Amongst these dashboards are:
- The Operations Dashboard
- The ESB Dashboard
- The EDI Dashboard
- The Monitoring Dashboard
- The Data Monitoring Dashboard
- The Analytics Dashboard
On a number of dashboards, you can add widgets from the collection of widgets that are provided by BizTalk360, or you can create your own widgets and add them to the dashboards. In certain cases, certain data can be viewed from different kinds of dashboards. For example, the EDI and ESB dashboards contain widgets which can be shown on their own dashboard, but also on the Operations Dashboard.
In most cases, the Operations Dashboard will be the first screen a BizTalk Administrator will see, after he has opened BizTalk360.
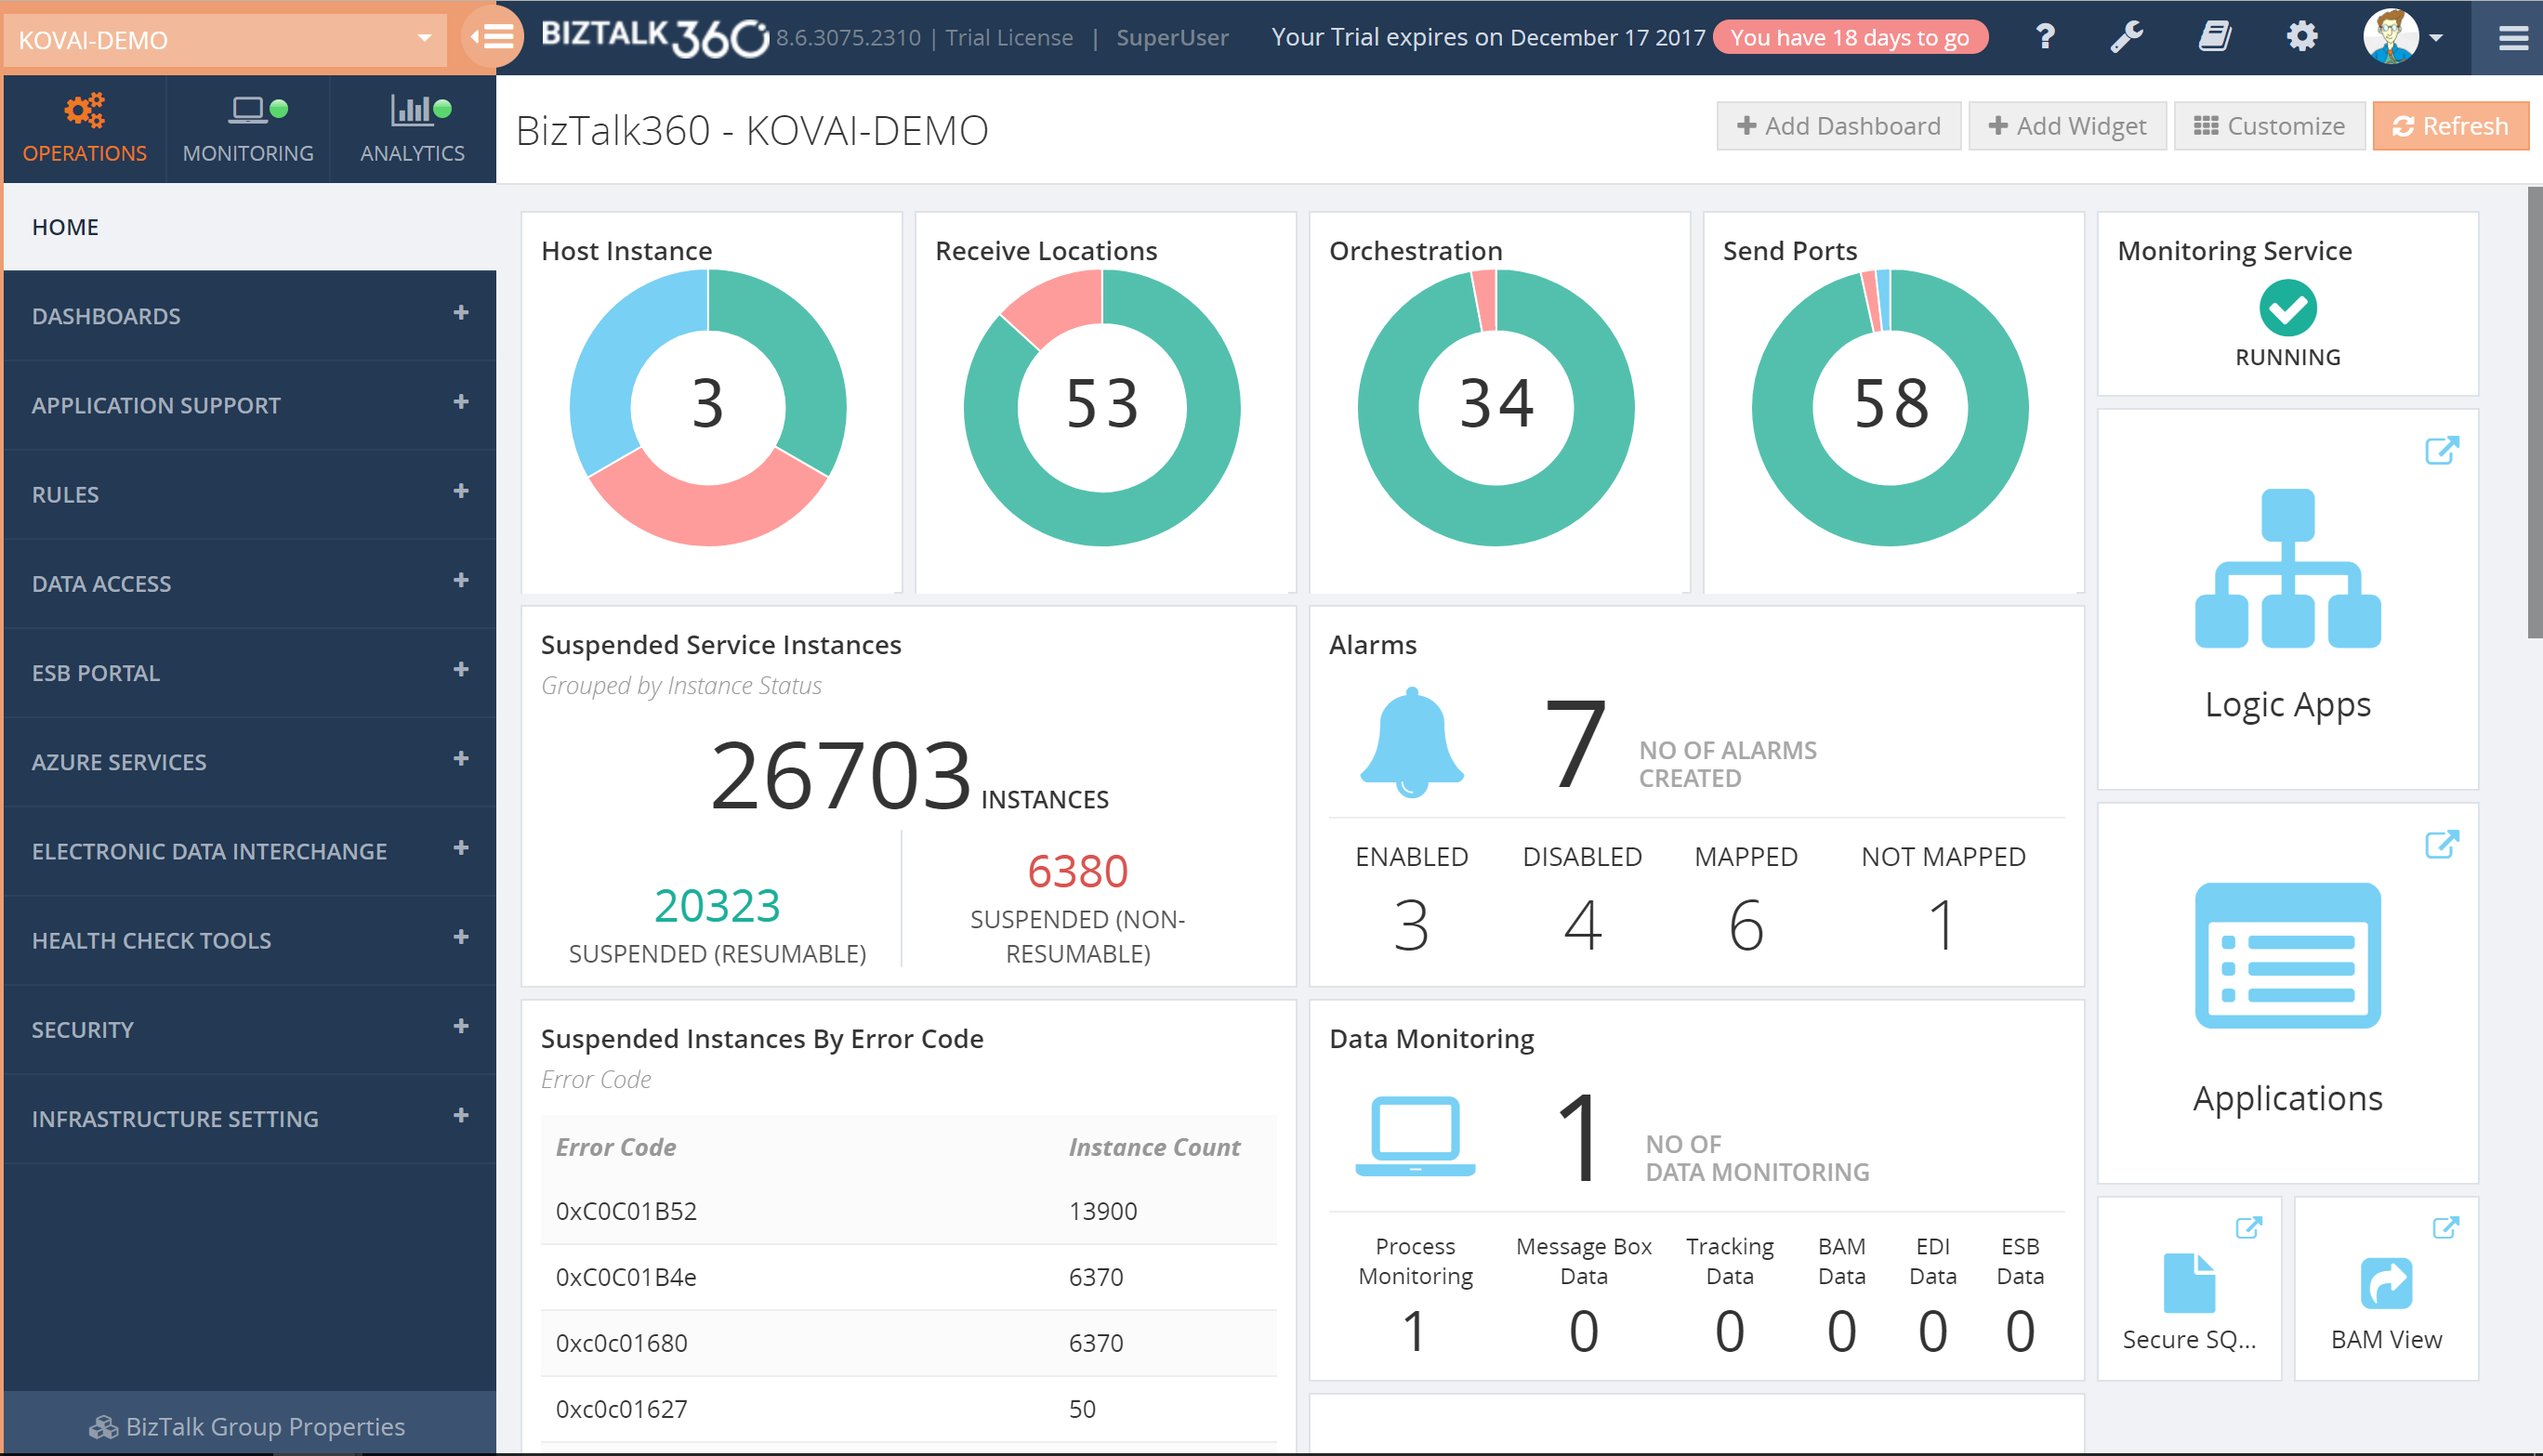
The Operations Dashboard, by default, already shows a number of widgets, but BizTalk Administrators can completely modify the layout of that dashboard to suit their needs. If the collection of widgets, which comes out of the box, is not enough, BizTalk360 allows administrators to create Custom widgets and add them to your dashboard. Besides the widgets, the Operations Dashboard can also contain pinpoints which are like shortcuts and provide you with easy access to all the different screens of the application.
Additionally, you can also create multiple dashboards if you like, to fit multiple purposes. For example, say, you can have Dashboards for particular interfaces or be setting them up for different kind of roles.
Download and Try BizTalk360 Free for 30 days today!
Download and try BizTalk360 on your own environments free for 30 days. Installation will not take more than 5-10 minutes.